Table of Contents
This past summer, countless people took vacations that they had postponed due to the pandemic. In many parts of the world, aircraft flying domestic routes were full, and airlines began to see a positive cash flow for the first time in over a year. Indeed, airlines were short of experienced staff and had difficulty maintaining ambitious schedules. However, many international borders remained effectively closed due to quarantines and the lack of recognition that vaccines can enable passengers to bypass quarantines. For these reasons, international travel remained a fraction of pre-pandemic levels.
The Changing Landscape of Travel, Update on COVID Restrictions
Countries are beginning to loosen their international border controls for vaccinated passengers – many only requiring a negative COVID-19 test prior to departure. Canada implemented less restrictive entry requirements on July 5, 2021 and the United States (US) did so as well several months later on November 8, 2021.
On July 1, 2021, the 27 European Union (EU) countries along with six other European countries implemented the European Union Digital COVID Certificate (EUDCC) to confirm testing, vaccine and/or recovery status in both paper and electronic form. While the US does not have a government issued Digital COVID Certificate, as shown in the table below, it does accept the digital certificates issued by other countries, most notably, the EUDCC and its United Kingdom (UK) equivalent.
US Acceptable Proof of COVID-19 Vaccination
| Documentation Type | Examples |
|---|---|
| Verifiable records (digital or paper) | Vaccination certificate with QR code1, digital pass via Smartphone application with QR code1 (e.g., UK National Health Service COVID Pass, EUDCC) |
| Non-verifiable paper records | Printout of COVID-19 vaccination record or a COVID-19 vaccination certificate issued at national or subnational level or by an authorized vaccine provider (e.g., the Center for Disease Control (CDC) vaccination card) |
| Non-verifiable digital records | Digital photos of vaccination card or record, downloaded vaccine record or vaccination certificate from official source (e.g., public health agency, government agency, or other authorized vaccine provider), or a mobile phone application without QR code1 |
Source: US CDC https://www.cdc.gov/coronavirus/2019-ncov/travelers/proof-of-vaccination.html#vaccine-proof
The air travel industry expects these actions by Canada, the EU and the US that loosened border controls for vaccinated travelers to generate a burst of pent-up demand, especially for leisure travel. Many US airports expect to serve 2019 levels of passenger demand during the holiday travel season. Airlines have already reported four- to five-fold increases in bookings for travel in November and December compared to last year.
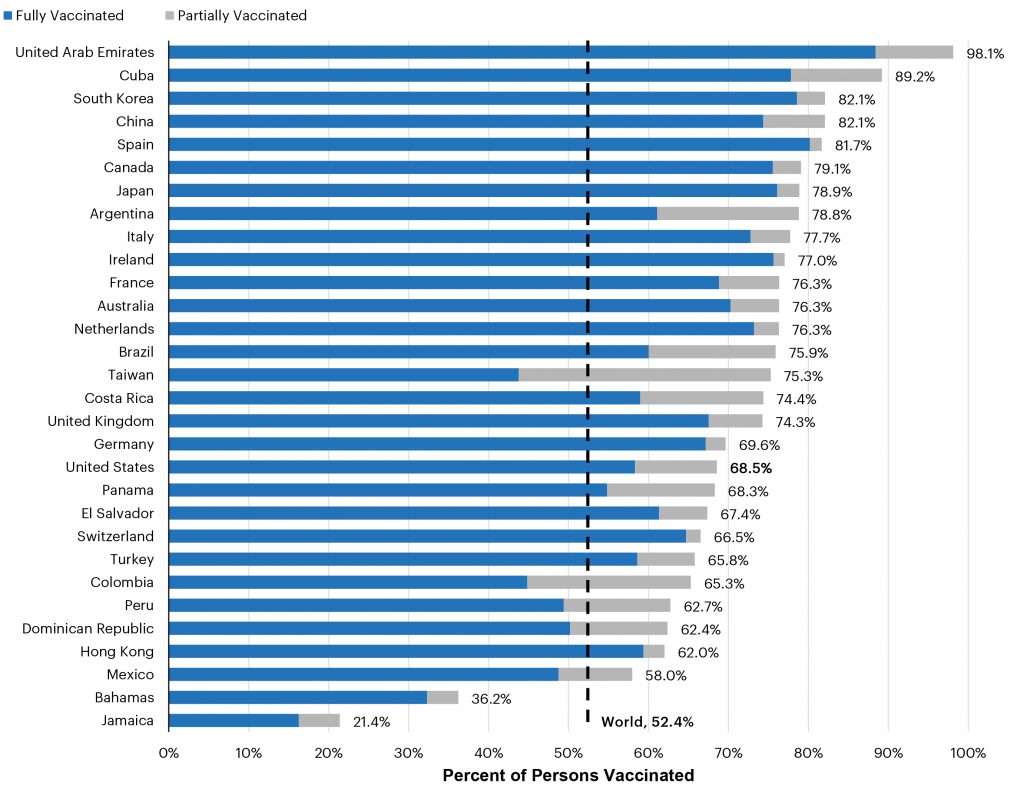
While the US lags many countries in vaccination rates, important international travel markets for the US, such as the EU, the UK, and many South American countries have vaccination rates that exceed the US rate. The new US rules enable these foreign nationals to enter the US with only a negative COVID test within three days of travel. On the other hand, travel from the US will be limited to the 58% of US citizens that are vaccinated.
Vaccination Rates for Selected Countries
(as of November 15, 2021)
Source: Our World in Data COVID vaccination data found online at https://ourworldindata.org/covid-vaccinations
Recent US Travel Trends
Using the US as an example, we can compare airport passenger and flight volumes for this past July versus actual passenger volumes for October and aircraft activity in October and November. The graph on the next page compares daily checkpoint volumes for the fourth Thursday in July 2021 to the same fourth Thursday in 2019. For many US airports, July is the peak travel month. Most of the airports with the least recovery of passenger volumes are international gateways serving trans-Atlantic and trans-Pacific destinations. However, southern international gateway airports that serve the US such as Caribbean and Central American destinations had fewer pandemic restrictions and had much stronger traffic recovery. It is also important to note that airports serving domestic vacation destinations on the south coast and mountain regions out west have had the strongest recovery. Airports with high market shares of low fare carriers have experienced the strongest recoveries of traffic.
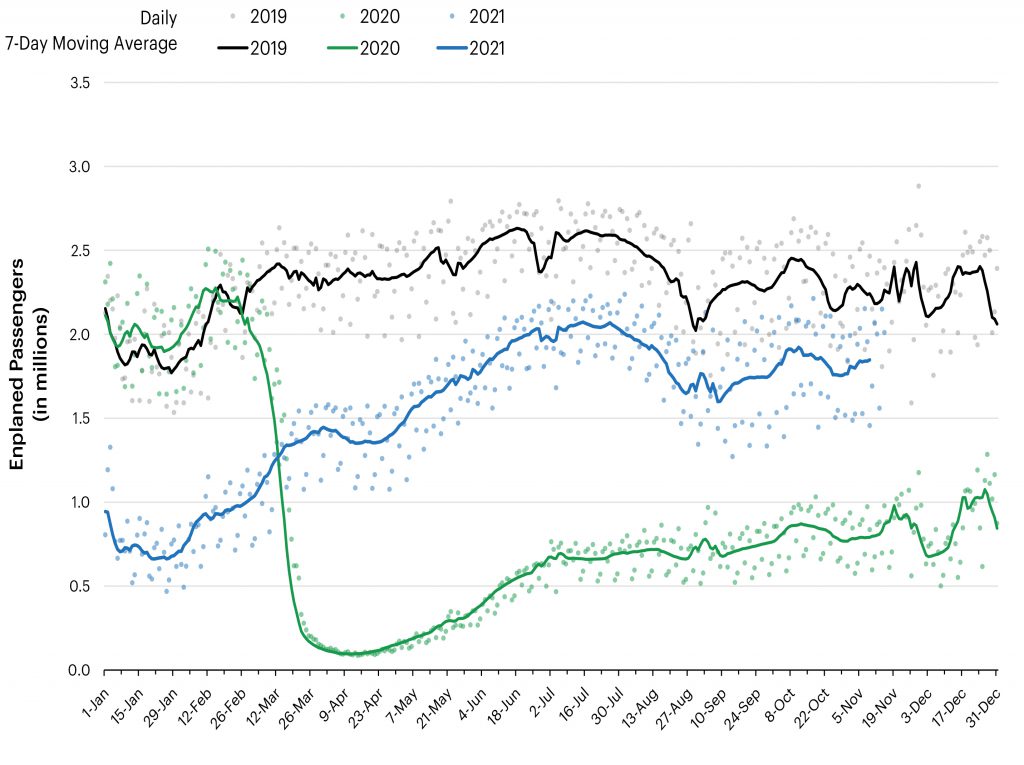
The US domestic travel industry has recovered sufficiently to start following the seasonal trends observed in 2019. The graph below shows that national passenger volumes at the Transportation Security Administration (TSA) checkpoints peaked during July and then followed a seasonal downward shift in volume during the latter half of August and into September. October volumes in both 2019 and 2021 were approximately 10 percent less than both of the 2019 and 2021 July months. This figure also shows that 2021 volumes are trending approximately 20 percent lower than 2019.
July Passenger Volumes at US Airport Checkpoints for 44 Large US Airports
(October 20, 2021 as percentage of October 23, 2019)
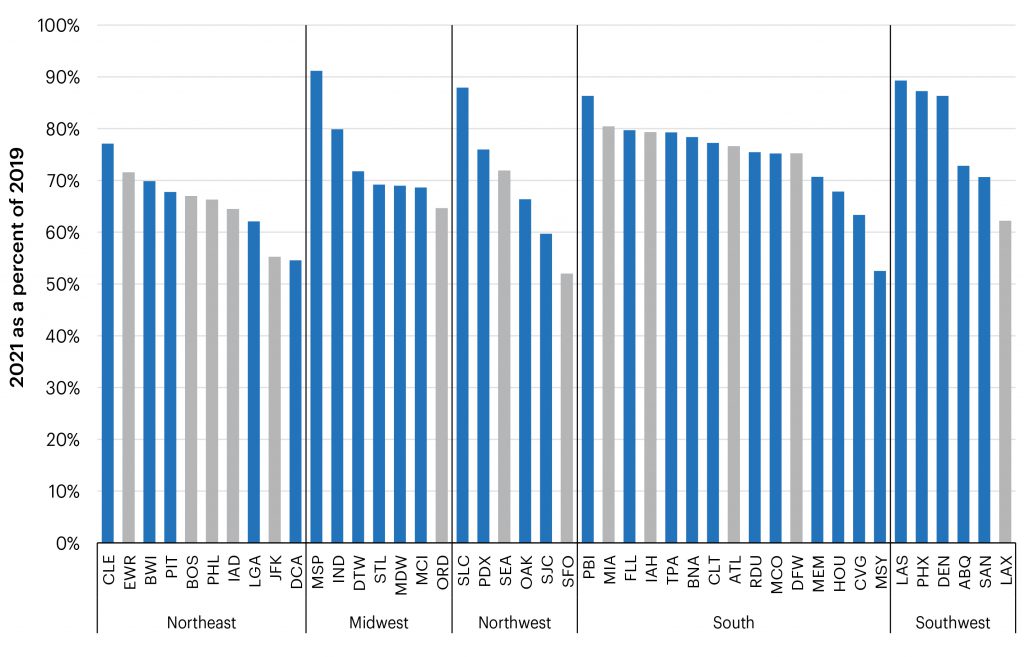
Note: Grey bars represent major international gateway airports.
Source: US TSA Daily Checkpoint Counts and Landrum & Brown Analysis
US National Daily TSA Checkpoint Passenger Count
(2019 through November 12, 2021)
Source: US Transportation Security Administration https://www.tsa.gov/coronavirus/passenger-throughput
The decline in passenger volumes through the TSA checkpoints is decidedly uneven. As shown in the graph below, four airports managed to show volume increases between July and October and 14 airports had passenger volume declines that were less than the national average. Three airports in the Northeast Corridor of the US including Reagan National Airport (DCA), LaGuardia Airport (LGA) and Boston Logan International Airport (BOS) all exceed the national trend in passenger volumes and had only recovered a comparatively low percentage of their 2019 demand. These airports historically also serve higher percentages of business travelers, so their superior performance indicates that some business travel demand may be starting to return. However, overall business travel remains weak. The airports with the largest decline in passenger volume serve southern US vacation destinations, so some of these declines in passenger volumes may still be normal seasonal variations in demand as vacation season ends in August.
Percent Change in Passenger Volumes at US Airport Checkpoints for 44 Large US Airports
(July 21, 2021 to October 23, 2021)
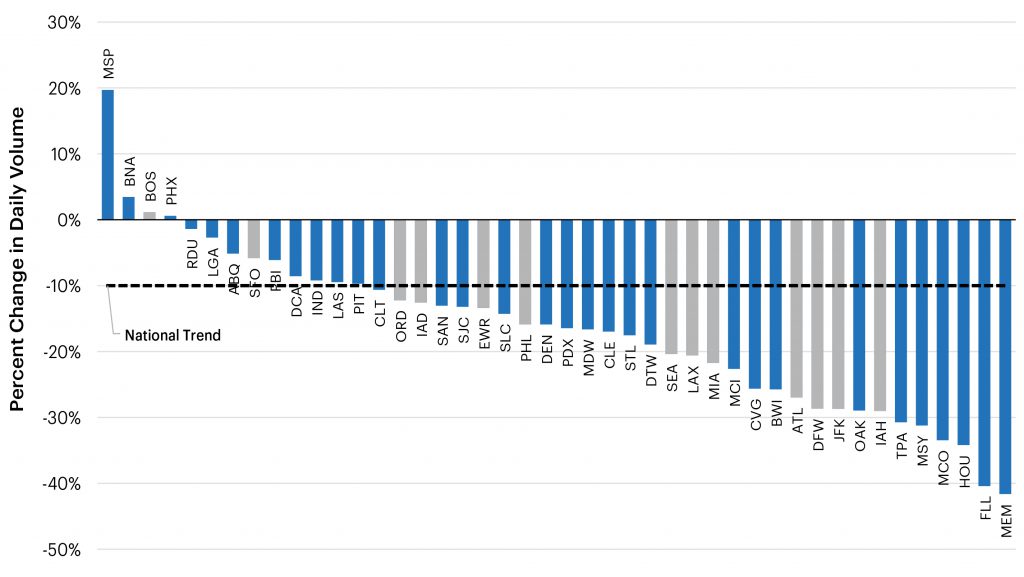
Note: Grey bars represent major international gateway airports.
Source: US TSA Daily Checkpoint Counts and Landrum & Brown Analysis
The graph below indicates that airlines have also adjusted the allocation of their aircraft fleets in response to changes in demand. Some airports that serve the Northeast Corridor of the US saw noticeable increases in aircraft activity. These include:
- Reagan National Airport (DCA)
- Newark Liberty International Airport (EWR)
- John F. Kennedy International Airport (JFK)
- LaGuardia Airport (LGA)
- Boston Logan International Airport (BOS)
Many airports that serve southern vacation destinations saw declines in their aircraft activity. The largest declines occurred at Dallas Fort Worth International Airport (DFW) and Charlotte Douglas International Airport (CLT), which are airline hubs that focus on the southern US.
With international travel to the US just reopening on November 8th of this year, the trans-Atlantic and Southern gateway airports will likely see a corresponding increase in travel and aircraft activity. The November increases in aircraft activity confirm this trend. Also notable are the increases in aircraft activity at airports that serve as gateways for trans-Atlantic travel including JFK, EWR, and BOS.
Percent Change in Aircraft Operations Volumes at 45 Large US Airports
(July 22, 2021 to November 4, 2021)
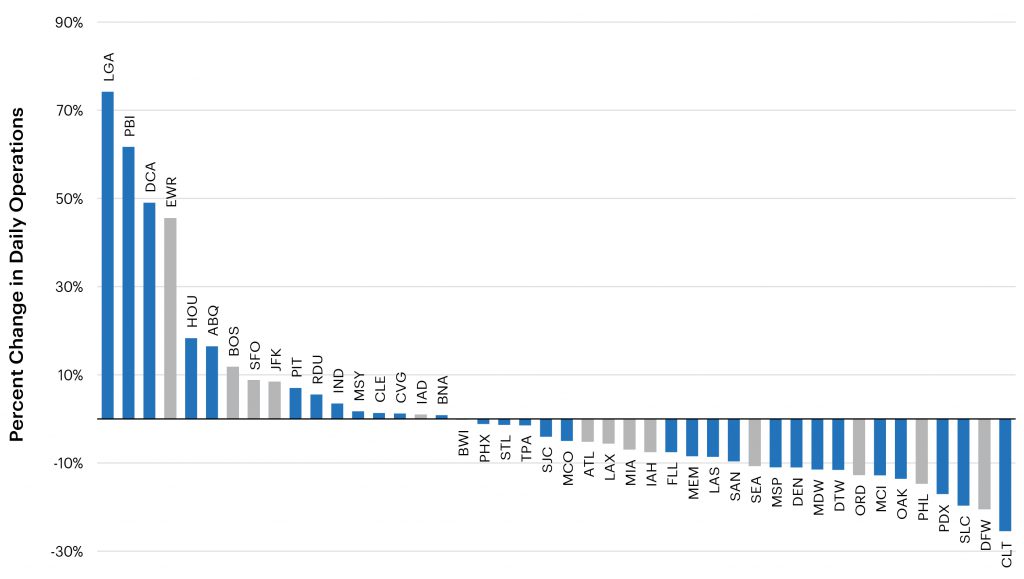
Note: Grey bars represent major international gateway airports.
Source: FAA OPSNET accessed via www.aspm.faa.gov
Gateways that serve trans-Pacific travelers, except for San Francisco International Airport (SFO) all saw aircraft activity decline between July and November of this year. While the US may have loosened their COVID-19 requirements for entry, many large Asian markets have not. Southern international gateways are also experiencing their normal seasonal declines in traffic. Some of these airports include:
Bookings and travel searches through travel agency websites are 14 to 100 percent above 2019 levels in many major markets. This is further evidence of pent up demand and that the traveling public is at least interested in flying again. Not all searches turn in to flights, as seats during popular travel periods like the November and December holidays and Spring Break will likely sell out quickly but it is a promising indication for future growth.
Week of November 1, 2021 Web Search Requests for Air Travel in Selected Cities
Nov 1. Weekly Searches (thousands)
| Market | 2019 | 2020 | 2021 | 2021 vs. 2019 |
|---|---|---|---|---|
| Detroit | 2,200 | 1,000 | 3,700 | 68% |
| Minneapolis | 2,500 | 1,000 | 3,800 | 52% |
| Dallas | 4,300 | 2,200 | 8,600 | 100% |
| Atlanta | 5,000 | 2,500 | 9,900 | 98% |
| Philadelphia | 2,800 | 1,400 | 4,700 | 68% |
| Boston | 7,700 | 2,000 | 8,800 | 14% |
| Houston | 3,200 | 1,700 | 5,800 | 81% |
| Washinton DC | 6,500 | 2,500 | 9,600 | 48% |
Returning Demand Meets a Lack of Supply, Airline Staffing Challenges
The capacity cuts that the airlines made by necessity at the beginning of the pandemic, will ultimately prevent them from serving the pent-up holiday travel demand and may hold actual travel volumes short of 2019 levels. While the US Government provided substantial aid to airlines during the pandemic, this aid was focused on keeping their staff employed, not on sustaining the entire cost structure of the airline. While most of the airline industry avoided involuntary layoffs, many airlines offered early retirement benefits to those employees who chose to end their careers. These incentives enabled the airlines to further reduce costs during a period of time with virtually no revenue and substantial fixed costs associated with their aircraft and ground operations. These highly senior employees that retired are permanently gone. Additionally, training pilots takes time, even when hiring pilots from their commuter airline subsidiaries or partners. Pilots must have as many as 1,500 hours as a pilot before they are even eligible to operate an air carrier aircraft2. Airlines started calling back pilots from paid leave in 2020 and 2021, as well as started hiring new pilots in 2021. However, many of these new pilots are not yet in the cockpits of scheduled flights. Further, a pilot in command of an aircraft (captain), must have 1,000 hours of airline flight experience.
The commuter airlines will have the hardest time staffing their flights, as many of their pilots have moved up to flying larger aircraft for their major airline partners. As a result, air service to small cities may have the hardest time recovering from the pandemic. While they may have service, their service may be less frequent than in the past and/or possibly with larger aircraft. Airlines will choose to serve the routes that will provide the best revenue for the hours of flight they provide. In the short-term, low fares may be hard to come by.
Beyond the Holidays, More International Travel?
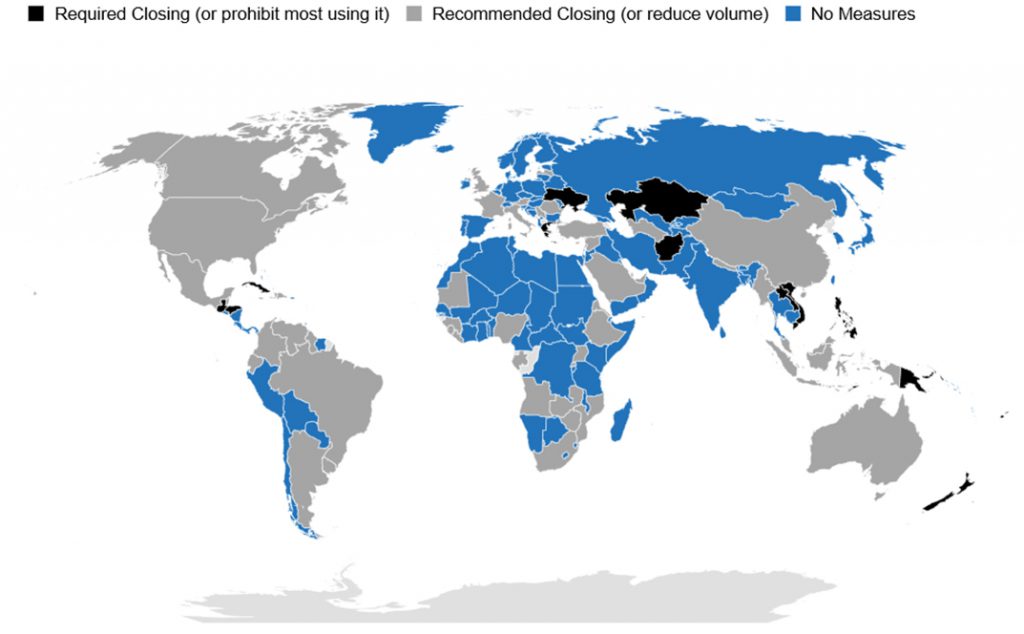
While domestic leisure travel has returned to pre-pandemic levels, international travel and business travel face a longer recovery period. After a holiday surge in international air travel, we expect the recovery to proceed unevenly, as countries constantly adjust their border controls to regulate the introduction of new COVID-19 cases. Virtually all countries employ a variety of border control measures to reduce or eliminate the possibility of introducing new COVID-19 cases. New Zealand and Japan have largely closed their borders to foreign visitors. Many like China, Russia, Germany and India quarantine (or a combination of quarantines and testing) all inbound travelers for various lengths of times from two to three weeks. As noted earlier, some countries allow a negative COVID-19 test to lift a quarantine requirement after the third day. Finally, countries in the EU, the UK, the US, Canada, Brazil, Mexico, and Pakistan screen passengers for documentation of vaccinated status. Vaccinated passengers can bypass quarantine and testing requirements.
Border controls will constantly evolve as countries change their policies as the pandemic rises and falls in each country. The volatility of border policies makes predicting travel volumes difficult for airlines and aviation industry analysts. The International Air Transport Association (IATA) provides and maintains an interactive world map as a service to airline passengers (https://www.iatatravelcentre.com/world.php) that displays more detailed information about entry requirements for each country.
Figure 8: International COVID-19 Border Controls
(as of November 16, 2021)
Business travel remains well below pre-pandemic levels for a variety of reasons. The pandemic forced many businesses to greatly expand their use of on-line meetings and adapt their work culture to make these meetings better communications platforms. Use of on-line meetings also reduces operating costs and businesses will want to find ways to effectively retain these cost reductions. That said, sales presentations, many conferences, and some operational meetings will slowly return to being in-person events. On-line loses some of the social connections that in-person contact creates and nurtures. While the benefits of these social connections are difficult to initially quantify, sales performance metrics and customer retention statistics will ultimately drive a return to many in-person meetings.
Worldwide Transition from Pandemic to Endemic
COVID-19 is here to stay. Public health goals in most countries no longer focus on “zero COVID”, but on managing the disease so that it does not place an undue burden on hospitals or other healthcare resources3. Vaccinating a high percentage of the population reduces the spread of the disease. However, for a variety of reasons, not all countries will vaccinate enough of their populations to eliminate the spread of COVID-19 within their borders. In addition, on-going research has yielded better treatments for the disease, which will further reduce the burden on healthcare resources.
Countries will shift to endemic management when vaccination rates achieve their internal goals and available treatments reduce mortality and the burden on their healthcare systems. Most historic pandemic illnesses became less lethal as they mutate (think of flu or measles) and treatment capabilities advance. Many immunologists expect COVID-19 to take this course.
Defining Terms, Evolution of COVID 19
An epidemic causes widespread disease in a region. A pandemic affects multiple countries or continents. A disease becomes endemic when it is manageable—defined, for instance, as not causing an undue burden on hospitals or other healthcare resources—but is unlikely to be eliminated because of the pathogen’s inherent properties.
Epidemiologists have historically stated that achieving a vaccination rate of 80% will be enough to reduce the R value – the Reproductive Number of COVID-19 to one or below. An R value of one means that each in infected person only infects one other person. Most countries have yet to achieve an 80% vaccination rate. Some countries (such as the US) may never achieve an 80% vaccination rate because we have substantial populations who refuse the vaccine. Fortunately, many people who survive a COVID-19 infection will have some natural immunity. Natural immunity is far more difficult to measure than vaccinated people because natural immunity may leave some people more prone to reinfection than others.
Our Longer Term Outlook
As a result of the varying rates of progress in managing COVID-19, along with varying standards used in establishing health policies, we believe that the return of international travel will be uneven:
- Travel across the North Atlantic to the UK, EU and much of the Middle East should return to 2019 levels in the summer of 2022, driven by strong leisure (vacation) demand. The return of business travel may be slower as some business interactions, such as internal company meetings, will remain on-line. By summer of 2022, most airlines will have worked through their staff shortages and should be able to operate their entire aircraft fleets.
- Travel from the US to India is expected to resume when flights recommence on November 30, 2021. Airlines are indicating that demand is strong and are adding service.
- Travel between the Americas should also return to 2019 levels in the summer of 2022. While vaccination rates continue to increase, countries in Central and South America do not have highly restrictive border controls and are not expected to impose them
- Travel across the Pacific will take longer to return. Important markets such as Australia, China, Japan and South Korea limit travel to “essential reasons”. China and Japan limit travel to returning nationals, foreigners with residency permits and diplomats. South Korea suspended two common types of short-term visas. Given their conservative approach to managing COVID-19 cases, we expect these restrictions to remain in place for the next six months and perhaps longer. In addition, lifting of restrictions may take gradually, especially from countries they consider having high case rates. Given, border opening experience in other travel markets, we expect a rapid return of former travel levels once most they lift their restrictions.
- Travel to countries with low vaccination rates will not likely return until 2023. While the worldwide vaccination rate continues to climb, distribution of vaccines continues to be uneven. This status applies to the entire continent of Africa and many countries in Southeast Asia, such as Pakistan, Bangladesh, Indonesia and the Philippines.
Some Final Thoughts
The holiday season should be strong in the US domestic air markets, continuing the trend seen in the summer of 2021 and strengthened by the reopening of bi-directional travel across the North Atlantic and between the Americas. Airline capacity will limit the return to normal volumes, especially to smaller markets.
Vaccines and on-going research on better treatments have finally started putting the pandemic phase of COVID-19 behind us. While COVID-19 will continue to be with us, its burden on healthcare resources should continue to decline. As a result, many of world’s largest international travel markets will return to mostly normal travel volumes either in 2022 across the North Atlantic and between the Americas; and in 2023 across the Pacific. Some markets in Southeast Asia, and likely all of Africa, will not see normal travel volumes until 2024.
1 https://www.cdc.gov/coronavirus/2019-ncov/travelers/proof-of-vaccination.html#vaccine-proof-ref-1
2 The specific requirement is: Meet the aeronautical experience requirements of FAR Part § 61.159. A pilot may be eligible if he or she was a military-trained pilot and has 750 hours total time, a graduate of a four-year bachelor degree program with an aviation major and has a total of 1,000 hours total time, a graduate of a two-year associate degree program with an aviation major and has 1,250 hours total time, or has 1,500 hours total time as a pilot.
3 https://www.wsj.com/articles/covid-endemic-vaccines-measles-smallpox-pandemic-coronavirus-11633015316, Accessed on October 28, 2021.
What is the L&B LAB?
The LAB is Landrum & Brown’s research and development unit. Our mission is to harness decades worth of industry knowledge and expertise to develop innovative solutions that support our clients along with promoting industry thought leadership.
This document was prepared by Landrum & Brown, Inc. | Richard.Barone@landrumbrown.com
Sign up to receive our next L&B LAB in your inbox!


